Methodology (Part II)
The second part of this project analyzes the benefits and costs of using the variance-minimizing strategy on a two-stock portfolio. It is known as a fact that the variance-minimizing strategy does not give the highest return over time (for example: stock A increases 2%, and stock B increases 10%. Investing 100% in the stock B would give the highest return—but the problem is: nobody knows for sure whether stock A or stock B would increase more when we invest.)
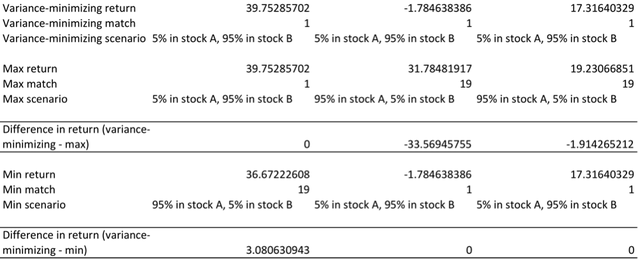
In order to evaluate the variance-minimizing strategy, I look at three different scenarios in the interactive Excel spreadsheet titled “ScenarioAnalysis”: First, the scenario that gives the maximum return; second, the scenario that gives the minimum return; third, the scenario that minimizes the portfolio variances.
For the first and second scenarios, I used the max function and min function in Excel, eg. =Max(D11:D29) and =Min(D11:D29). Then I used the match and offset to return the scenarios that gives the maximum and minimum returns respectively, eg. =Match (D42,D11:D29,0) and =OFFSET($A$11, D42-1, 0). For the third scenario (ie. the variance-minimizing scenario), I simply used the output from the Python program that I have written. A snapshot for the three-scenarios comparison is as follow:
The second part of this project analyzes the benefits and costs of using the variance-minimizing strategy on a two-stock portfolio. It is known as a fact that the variance-minimizing strategy does not give the highest return over time (for example: stock A increases 2%, and stock B increases 10%. Investing 100% in the stock B would give the highest return—but the problem is: nobody knows for sure whether stock A or stock B would increase more when we invest.)
In order to evaluate the variance-minimizing strategy, I look at three different scenarios in the interactive Excel spreadsheet titled “ScenarioAnalysis”: First, the scenario that gives the maximum return; second, the scenario that gives the minimum return; third, the scenario that minimizes the portfolio variances.
For the first and second scenarios, I used the max function and min function in Excel, eg. =Max(D11:D29) and =Min(D11:D29). Then I used the match and offset to return the scenarios that gives the maximum and minimum returns respectively, eg. =Match (D42,D11:D29,0) and =OFFSET($A$11, D42-1, 0). For the third scenario (ie. the variance-minimizing scenario), I simply used the output from the Python program that I have written. A snapshot for the three-scenarios comparison is as follow:
Finally, I use one indicator to judge whether; I called it effectiveness indicator:
Effectiveness indicator = Σ(Variance-minimizing return – minimum return) + Σ (variance-minimizing return – maximum return)
In this indicator, Σ(Variance-minimizing return – minimum return) proxies for the benefits of applying the variance-minimizing strategy over the three consecutive years, because this term represents the protection against downside losses by using the variance-minimizing strategy. On the other hand, Σ (variance-minimizing return – maximum return) proxies the costs of the applying the variance-minimizing strategy over the three years, because this terms represents the amount of potential upside gain that has to be sacrificed by applying the variance-minimizing strategy. If the indicator is positive, then the benefits of applying minimizing the portfolio variances outweighs its costs, and it is worth pursuing the variance-minimizing strategy; if the indicator is negative, then the costs are greater than the benefits, and it is not worth pursuing the variance-minimizing strategy.
