Results
I wrote a wrapperFunction() in Python to run the entire ‘experiment’. wrapperFunction() randomly selects 10 pairs of stock from the 20 stocks available and return the variance-minimizing strategy for each pair of stock. Then I used the aforementioned effectiveness indicator in the Excel ‘ScenarioAnalysis’ spreadsheet to gauge whether it is effective to apply the variance-minimizing strategy when investing in these 10 pairs of stock. If the indicator is positive, we conclude that it is effective to apply the variance-minimizing strategy; if the indicator is negative, then it is not effective to apply this strategy. The following table summarizes the results for 15 pairs of stocks picked randomly.
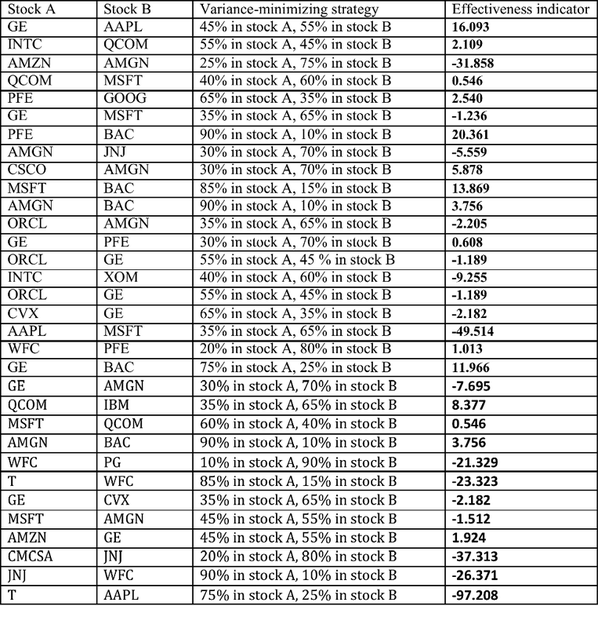
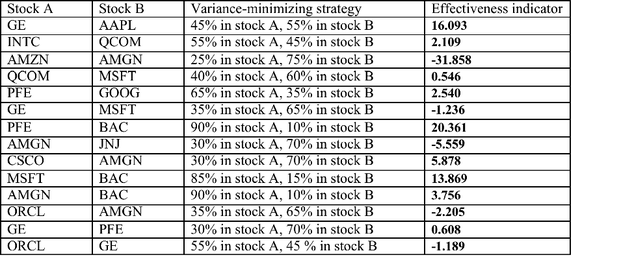
I wrote a wrapperFunction() in Python to run the entire ‘experiment’. wrapperFunction() randomly selects 10 pairs of stock from the 20 stocks available and return the variance-minimizing strategy for each pair of stock. Then I used the aforementioned effectiveness indicator in the Excel ‘ScenarioAnalysis’ spreadsheet to gauge whether it is effective to apply the variance-minimizing strategy when investing in these 10 pairs of stock. If the indicator is positive, we conclude that it is effective to apply the variance-minimizing strategy; if the indicator is negative, then it is not effective to apply this strategy. The following table summarizes the results for 15 pairs of stocks picked randomly.
To allow a more in-depth analysis, I decided to expand my results from observing 15 pairs of stocks to observing 32 pairs of stocks. The following table summarizes the results for 32 pairs of stocks picked randomly (the first 15 pairs of stocks are those appeared in the table above):